fbpx
Search
Close this search box.

How to Download, Share, or Sort Data

Beneath each visualization is a Tableau logo with several icons to the right, including:

  • SHARE icon allows you to share a particular view with all selections you made by e-mail, twitter, or FaceBook.
  • DOWNLOAD icon allows you to select your file format to download the data based on the selections you made for the visualization. If you chose Statewide 2018 data, for example, that is what will be downloaded.
    • Image (.png)
    • Data – a chart pops up with the data, with an option to download using CSV
    • Crosstab – another way to download data, using your choice of Excel or CSV
    • PDF
    • PowerPoint
    • Tableau Workbook
  • Full Screen View
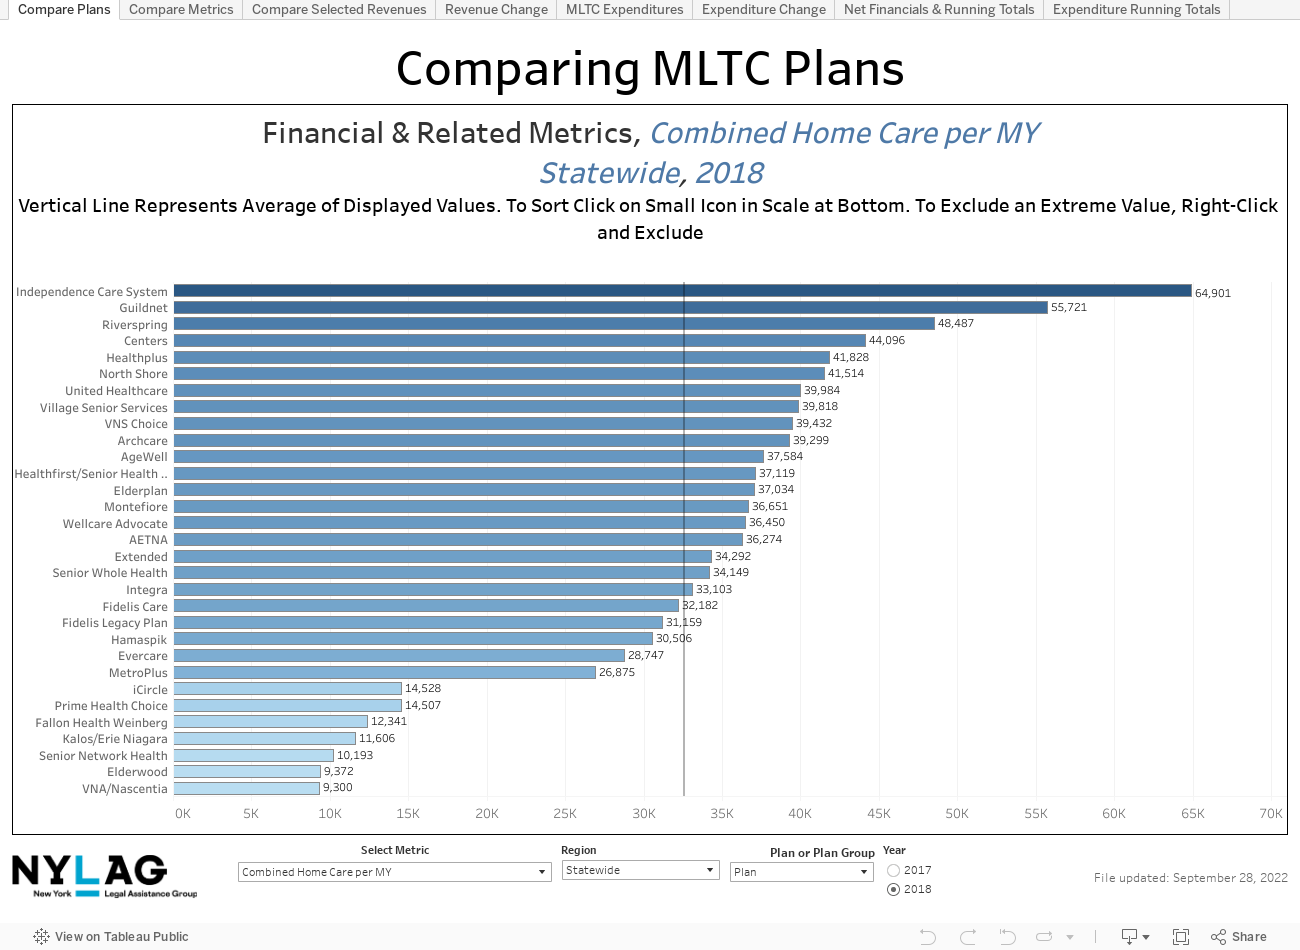
  • To Sort the order in which the plans appear in the visualization, in some of the graphs you can hover your mouse over the horizontal axis at the bottom and this icon will appear.  You may need to click on the axis first – the axis will change color and this icon  appears with up and down arrows.   Click on the icon to re-order the plans from high to low or alphabetically. 
  • When you hover your mouse over the horizontal axis, if you click on this icon, a table appears with the data in the visualization based on the selections you made. You can download it as described above. 

Guide to Using the MMCOR Consolidated Finance Table

Data source: MMCOR Schedule B–Revenue and Expense statement

For each of the eight tabs, you may select to view and download the data by region (statewide or one of four regions) and year (2017 or 2018). See Glossary for some definitions and MMCOR instructions for others. Note that that some plans closed, merged, or changed names—see list of plans to see how names or abbreviations used in the visualizations. 

Notes on some of the metrics:

  1. “Total Medical and Hospital Expenditures” is the total of all non-administrative expenses.
  2. “Combined Home Care per MY” combines Home Health, Personal Care, and CDPAP,  which can also be viewed individually.  
  3. “Combined Adult Day Health and Social Day Care” combines both of those services, which can also be viewed individually.
  4. “Net income (loss)” shows which plans had net income (were in the black) and which had a loss in either of the years or regions.
  5. “NAMI/spenddown”: the MMCOR Instructions tell plans not to reduce the amounts determined by the local Medicaid agency by the amount not collected from the consumer.

The tabs in the order they appear in the viz are as follows:

  1. Compare Plans–Expenses and Revenue per Member year: Select any of 15 types of services as well as administrative expenses to view the expenditures per Member year (MY), which is a proxy for amount spent per member. See glossary. Viewing the cost per Member Year enables a comparison between plans, no matter how big or small.  
  2. Compare Metrics: Select two of over 20 different metrics and display one on the horizontal axis (Metric 1) and one on the vertical axis (Metric 2). The metrics are expenditures for various services and types and amounts of income. The relationship between the two metrics can then be visualized, on a statewide or regional basis. 

For example, using “Combined Home Care per MY” on the horizontal axis, and “NF Expenditure per MY” on the vertical axis shows a correlation between these expenses, with a higher amount spent on home care correlated with a lower amount spent on nursing facility care. The size of the dots is based on the number of members enrolled in the plan.

  1. Compare Selected Revenues: View and download the amount of key revenue lines for each plan, by region, or statewide, for 2017 and 2018. 
  2. MLTC  Expenditures: Select among the same list of services as in the first tab, except instead of showing the amount spent per Member Year, this chart shows the total amount spent.   
  3. Revenue Y-T-Y Change (Year to Year): Shows the growth or decrease in plan revenue from 2017 to 2018. 
  4. Expenditure Y-T-Y Change: Shows the increase or decrease for the expense of each service from 2017 to 2018, by plan. You may select regional or statewide data.
  5. Selected  Net Financials and Running Total Revenue: Shows the running total of all revenue received by all MLTC plans by year, starting with the highest-revenue plans. In 2018 total revenue of all MLTC plans was $12.555 billion.
  6. Expenditure Metric and Running Total of Expenses: User can select a service and view the running total of expenses paid by all plans on the service by year, starting with the plan spending the most on the selected service.
Scroll to Top